


The International Executive MBA is designed to solve the most critical challenges faced by leaders like you in a globalised and constantly changing business env
 Blog
Blog
18 de January de 2026
Automated Marketing Reports: From ‘Excel paralysis’ to real ROI (Guide with Power BI, Looker and Tableau Templates)
Sumario:
Are you tired of the chaos in your marketing reports and wasting time pasting data into Excel? Discover how templates for Microsoft Power BI or Google Looker and connector services, ETL, etc. such as Windsor.ai can transform decision-making with automation, artificial intelligence, and accurate multi-channel attribution. Forget about ‘data paralysis’ and access visual dashboards that show true ROI and the real customer journey. Imagine a system that eliminates human error, connects all your sources, and allows you to scale effortlessly. If you're looking to turn your data into competitive advantages and break through uncertainty, this guide is the key to leading the marketing of the future.
Summary:
- The fundamental problem: Data silos and the cost of ignorance
- The technical solution: ETL and data connectors (Windsor.ai)
- New developments in marketing analytics in 2026: Artificial Intelligence and new horizons
- Power BI templates for marketing: From theory to practice.
- The ‘Holy Grail’: Multichannel Marketing Attribution
- Google Looker Studio Templates: The Agile Alternative
- Conclusion: Automation as a Competitive Advantage
If there is one uncomfortable truth that I often repeat in my master's classes and management meetings, it is this: Marketing without data is just opinion, but data without automation is an operational nightmare.
As navigators in this digital ocean, we often find ourselves bailing water. We spend more time copying and pasting cells from Facebook Ads to Excel than analysing the ship's course. Napoleon said that ‘war is ninety percent information,’ and in modern marketing, that information flows at such a speed that if you try to capture it manually, you've already lost the battle before you start.
In this article, we're going to apply first principles reasoning to break down why traditional marketing reports fail and how tools like Windsor.ai not only solve the technical problem, but also free up the CMO to do what they should be doing: thinking strategically. In addition, we'll put a special focus on how to integrate this data into robust Business Intelligence environments.
The fundamental problem: Data silos and the cost of ignorance
To understand why we need to automate, we must first understand the root problem. A marketing report is not an end in itself; it is a tool for reducing uncertainty in decision-making.
However, the average marketer faces fragmentation (silos). You have data in:
- Google Ads / Search Ads 360 (Costs, CPC).
- Meta Ads (impressions, reach).
- CRM (Microsoft Dynamics 365 Sales and Marketing, Salesforce, HubSpot - actual sales).
- Google Analytics 4 (on-site behaviour).
- Google Search Console, Sistrix, ahrefs or Kiwosan (search engine result page (SERP) positioning).

The traditional method involves downloading different CSVs (Comma-Separated Values), cleaning them in Excel (‘dashboard for Excel’ is still a popular search, unfortunately) and trying to cross-reference the dates. This violates the principle of efficiency.
Symptoms of a broken reporting system:
- Latency: You make decisions based on last week's data because the report takes three days to ‘cook’.
- Human Error: A wrong ‘copy-paste’ in an Excel cell can throw your budget off by thousands of pounds.
- Attribution Blindness: You see clicks on Facebook and sales in the CRM, but you don't see the thread that connects them.
The technical solution: ETL and data connectors (Windsor.ai)
This is where the concept of ETL (Extract, Transform, Load) comes into play. We need a pipeline that connects the water sources (advertising platforms) to the reservoir (your dashboard).
Why Windsor.ai and not ‘do it by hand’?
There are many services that make life easier for a CMO or marketing professional, allowing them to invest their time in analysis rather than preliminary tasks, which are equally or more important but often go unappreciated. Some of the most popular services are: Winsor.ai, Supermetrics, Funnel.io, Dataslayer.ai, etc. Like everything in life, each of them has its advantages and disadvantages, and after trying many of them, I've settled on Windsor.ai, which is the service we teach our students in the International Master's Degree in Digital Marketing with a Specialisation in Artificial Intelligence. The reasons for this choice could fill another article, but for the topic at hand, suffice it to say that Windsor.ai acts as that universal connector in a reliable, economical and efficient manner.
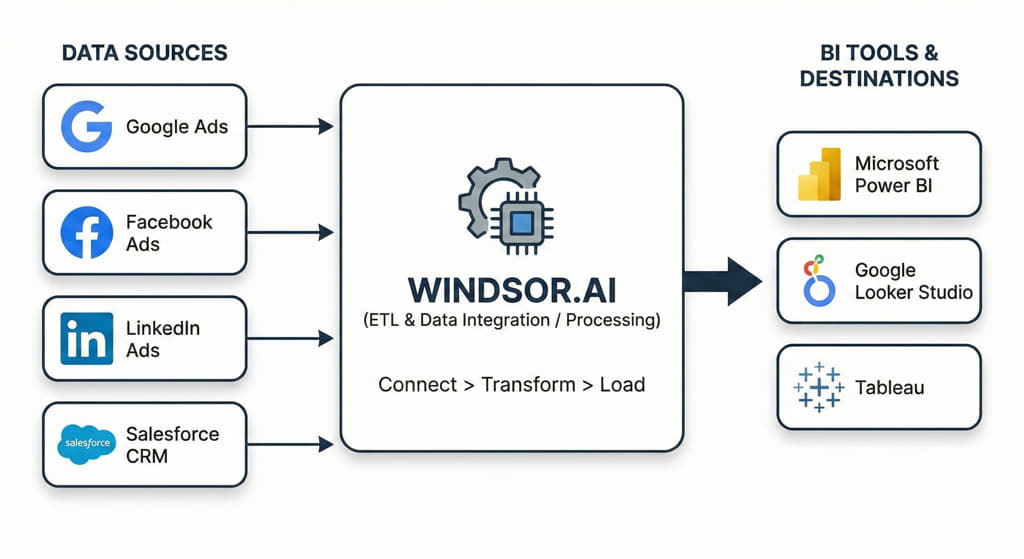
Windsor.ai is not just a reporting tool; it is a data infrastructure that allows you to:
- Connect: Extract data from more than 325 platforms/sources (Google Analytics, TikTok, LinkedIn, Google Ads, etc.).
- Transform: Automatically normalise campaign names and dates.
- Load: Send clean data to your preferred destination, whether it's Microsoft Power BI, Google Looker Studio (formerly Data Studio) or even Tableau and cloud services such as Snowflake or BigQery from Google Cloud.
When analysing industry keywords, we see a high level of interest in ETL tools. This indicates that the market is maturing; we no longer seek only to ‘view’ data, we want to ‘manage’ it, transforming it so that its quality does not affect the results of the analysis.
The tyranny of data quality: Why the model beats the algorithm
In today's Business Intelligence ecosystem, there is a dangerous belief that the sophistication of an AI algorithm or the visual elegance of a dashboard can compensate for poor data architecture. From a first principles perspective, this is impossible. AI and DAX are not magicians; they are multipliers. If you multiply zero (or garbage) by a million, the result is still zero.
Data transformation is not a ‘cleaning’ task; it is a task of semantically defining business reality.
2. Market evidence (Gartner & Forrester)
Studies by leading consulting firms quantify this problem with brutal clarity, moving away from anecdotal evidence to focus on the financial and operational impact:
- The Cost of Inaction: According to studies such as Gartner's, poor data quality costs organisations an average of £10.9 million per year. This cost is not only operational; it is a lost opportunity cost in strategic decision-making.
- The AI Barrier: Gartner predicted that by 2025, 30% of GenAI (Generative AI) projects would be abandoned after proof of concept due to poor data quality, inadequate risk controls, or escalating costs. AI cannot ‘fix’ dirty data; it amplifies it.
- The 80/20 Principle: Confirmed by articles on effective time management in the Harvard Business Review, data scientists and analysts spend 80% of their time discovering, cleaning, and organising data, leaving only 20% for actual analysis. For example, in Power BI, this translates into hours wasted writing complex DAX measures to patch a poor data model (a Flat Table instead of a Star Schema).
2. Impact on Reporting (Power Query & Power BI)
Taking the analysis of the physics of Power BI's VertiPaq engine as an example, we can see how data transformation is non-negotiable:
- Performance and Compression: A non-normalised (untransformed) model forces the engine to scan massive tables. A model transformed into a star schema optimises cardinality and compression.
- DAX Complexity: Without prior transformation, DAX becomes unnecessarily complex (CALCULATE with multiple costly FILTER filters). With transformed data, DAX is elegant and fast.
3. Critical Impact on AI (Copilot and Machine Learning)
This is where the risk becomes existential. When we query an AI (such as Copilot in Power BI) about our data:
The AI Axiom: AI does not understand your business; it understands the relationships you define in your model.
If the data is not transformed and the relationships are not clear:
Hallucinations: AI will invent connections where none exist.
- If you have not explicitly defined the relationship between ‘Sales’ and ‘Calendar,’ the AI will not be able to perform reliable temporal intelligence.
- Confidence bias: The AI will deliver an erroneous answer with complete confidence and eloquence. This is more dangerous than having no answer at all.
For many of these problems, services such as Windsor.ai eliminate technical friction. Instead of maintaining Python scripts that break every time Meta updates its API (Application Programming Interface), a service like Windsor abstracts us from the typical problems associated with using APIs: programming knowledge, constant changes by platforms, etc., with a professionally maintained connector that is easy to use and always works.
Comparison Table: Raw Data vs. Transformed Data
For a manager, the difference between investing in ETL (Extract, Transform, Load) or skipping it can be summarised in the following impact matrix:
Don't transform data ‘just in case.’ Transform it because AI is only as intelligent as your data model allows it to be. In the age of artificial intelligence, data engineering is the new marketing: if you don't define your narrative in the data, the market (or the algorithm) will define it for you, and it will probably be wrong.
New developments in marketing analytics in 2026: Artificial Intelligence and new horizons
It is vital that as managers we are aware of the latest developments that we should seek and demand in this type of service for marketing information management:
- AI Query Builder (December 2025): Windsor has launched a feature that allows you to query your data using natural language.
- This is a paradigm shift; we are moving from writing SQL to ‘asking’ the data.
- New marketing connectors (January 2026): For example, support for TikTok Shop has just been added, which is vital for those of us who operate in B2C markets with young audiences, as well as improvements to financial connectors such as Visma e-conomic.
- Deep integration with Snowflake and BigQuery: For organisations with large volumes of data (Big Data), the ability to send data from TikTok Ads or LinkedIn Ads directly to Snowflake is critical for advanced attribution models.
Power BI Templates for Marketing: From Theory to Practice.
As is well known, I have a preference for Microsoft Power BI due to its capabilities over other solutions, such as the ease of data collection and transformation, its modelling, the ability to perform analyses with Big Data power, the creation of visually appealing dashboards with storytelling, the use of Artificial Intelligence in analysis with total control of data and confidentiality, etc. Windsor.ai shines here because it offers what many of us are looking for: ready-to-use Power BI templates for marketing.
How to set up your dashboard in 3 steps?
- Connection: In Windsor.ai, select your sources (e.g. Facebook Ads + Google Ads).
- Destination: Choose ‘Power BI Desktop’ or ‘Power BI Web’. Windsor generates an API URL or an M script.
- Visualisation: Download the .pbit file (template) and when you open it, simply paste your API Key.
What do we gain from this?
- Unified data models: You will see a ‘Costs’ table that automatically adds up Google and Facebook spending.
- Pre-calculated DAX measures: You don't have to invent the ROAS formula; the template already has it.
- Interactivity: Unlike a static PDF, a Power BI report allows your CEO to filter by region, product, or campaign in real time.
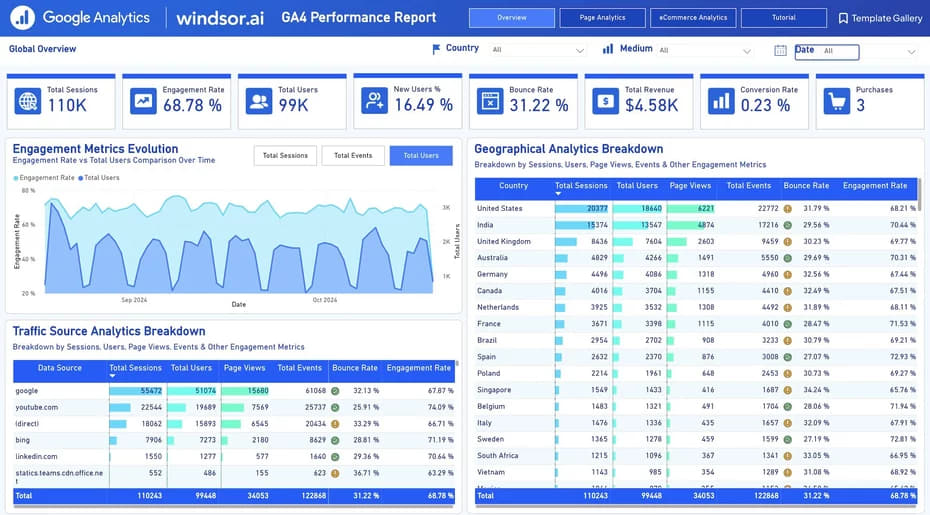
Screenshot of a Power BI dashboard from Google Analytics 4 (GA4) Dashboard Template on Power BI showing website traffic data.
The ‘Holy Grail’: Multichannel Marketing Attribution
One of the terms with the highest CPC in our analysis is marketing attribution. And with good reason. It is the most complex and valuable problem to solve.
By default, Google Analytics 4 and most CRMs operate under ‘last click’ models. This is like giving all the credit for a goal to the striker who kicks the ball, ignoring the midfielder who created the play.
The real customer journey:
- User sees an ad on LinkedIn (Awareness).
- User searches for your brand on Google days later (Consideration).
- User receives an email and makes a purchase (Conversion).
If you use manual reports, you will see three isolated events. If you use Windsor.ai to join the data, you can apply multi-touch attribution (MTA) models. Windsor allows you to visualise the entire customer journey, assigning fair credit to each channel. This is vital to avoid cutting the budget for ‘support’ channels (such as Display or Social) that do not seem to convert but are essential to initiate the sale.
Data-driven attribution can be analysed using different methods: the traditional last click, first interaction, time-based, linear, position-based, page view, time-based, or one that, according to various authors, has a clear technical winner: the Markov model.
1. What is a Markov Model in Marketing?
From a fundamental point of view, Markov models the Customer Journey as a graph of interconnected states.
- The Nodes (Vertices): These are your points of contact (SEO, YouTube, Twitter, Display).
- The Edges: These are the mathematical probabilities of transition from one state to another.
It is not about ‘giving credit,’ it is about calculating the probability of movement. For example: What is the exact probability that a user who visits your Twitter (State A) will move on to the website (State B) or abandon the process (State C)?
2. The Mechanics: The ‘Removal Effect’ The true power of Markov, and what sets it apart from Shapley or heuristic models, is its ability to measure the ‘indispensability’ of a channel using the Removal Effect.
- The Thought Experiment: The algorithm simulates what would happen to the overall conversion rate if we removed a specific channel (e.g., SEO) from the ecosystem.
- The Result: The drop in total conversion probability represents the actual value attributed to that channel. If you remove SEO and Display conversions drop by 20%, SEO gets that credit, even if it wasn't the last click.
3. Case Study: The Last Click Fallacy
Kolster illustrates this with a common chain: SEO -> YouTube -> Display Ads -> Conversion
- Last Click View (The Old School): Assigns 100% of the credit to Display Ads. Completely ignores that the user arrived via SEO. It's like congratulating only the striker who pushes the ball and forgetting the through ball from midfield.
- Markov View (Reality): Detects that SEO initiated the chain and that YouTube acted as a necessary bridge. Recognises that without the previous steps, the probability of the Display converting would be much lower.
Google Looker Studio Templates: The Agile Alternative
Although my preference is Power BI because of its robustness, I cannot ignore Google Looker. For agencies or freelancers who need to share quick reports with external clients, Looker Studio is a good solution because it is free and easy to use.
In this case, Windsor.ai offers templates and native connectors for Google Looker Studio. The advantage here is speed: you can clone an SEO or PPC report template in seconds and have a shareable link ready for your client.
Key differences for decision making:
- Use Power BI if: You need complex modelling (DAX), enterprise data security, and cross-referencing with financial data from the ERP.
- Use Looker Studio if: You need agility, free access, and quick visual integration with the Google ecosystem.
Conclusion: Automation as a competitive advantage
Back to first principles: the goal of marketing is to generate value and growth. Spending 10 hours a week updating spreadsheets does not generate value; it generates fatigue.
Integrating tools like Windsor.ai is not an expense, it is an investment in mental clarity. It allows us to:
- Justify the investment: Demonstrate ROI with accurate financial data to the management committee.
- Break down silos: View marketing as a holistic system, not as isolated channels.
- Scale: Managing 50 campaigns requires the same reporting effort as managing 5.
As professionals, our responsibility is to seek the truth in data. And the truth, today, requires tools that are up to the complexity of the market.

Masters relacionados


Agri-food is a strategic sector for both the national and international economies.


A company or organization that anticipates, identifies needs and threats, foresees, and makes strategic and operational decisions based on Comprehensive Risk Management


In ENAE Business School's Official Master in Logistics and Operations Management program, you will learn how to analyse the performance of a company's operation


The Master in International Trade, E-commerce and AI Concentration is designed to prepare professionals to lead international business operations in a global, d
Artículos recomendados
Automated Marketing Reports: From ‘Excel paralysis’ to real ROI (Guide with Power BI, Looker and Tableau Templates)
Are you tired of the chaos in your marketing reports and wasting time pasting data into Excel?…
Create a LinkedIn account: the first step to transforming your SME
What are you doing to make your company visible? Do you think María de Lugo knows about your…
The Relevance of a Master's Degree in Digital Marketing
In today's business landscape, digital marketing has established itself as one of the fundamental…
También te podría interesar leer

Technical expertise gets you in the room. Soft skills determine whether you stay, lead and grow. As automation reshapes entire industries and AI takes over increasingly complex tasks, the one category of competencies that remains distinctly human —…

Most organizations have no shortage of initiatives, what they consistently struggle with is delivering them. Ideas get approved, budgets get allocated, teams get assembled and then something goes wrong. Deadlines slip, costs balloon, scope expands…

These days, most organizations have no shortage of data. What they are short of is the ability to make sense of it. Millions of records flow through business systems every hour and the professionals who can turn that noise into clear, actionable…